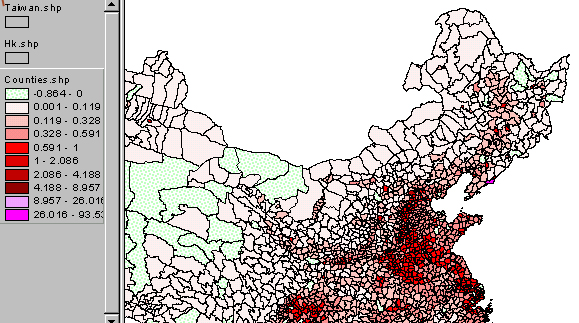
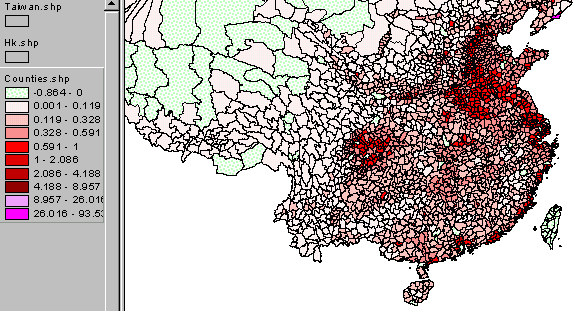
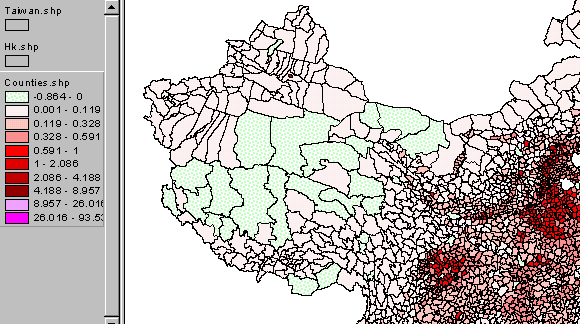
Cities stand out quite clearly, since they're densely populated and generally small landscape units. And mountainous areas are, it shouldn't surprise, relatively sparsely populated.
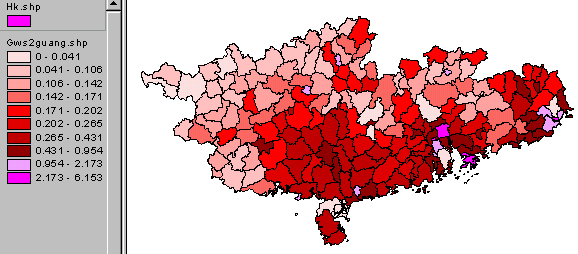
But it's possible to make some interesting maps, even with the limitations: Northeastern China, the Southeast, and the West. Since I'm particularly interested in the southeast coast, here's a view of that. The colors express the variation for all of China, and of course you'll see different things by looking just at a province --by JOINing areapop3.dbf to existing shapefiles, as we've already done in ArcView4. So here's what I get for Guangdong and Guangxi:
Cities stand out quite clearly, since they're densely populated and generally small landscape units. And mountainous areas are, it shouldn't surprise, relatively sparsely populated.
I want you to use the areapop3.dbf data to make density maps of your provinces, and add them to the Province pages as PhotoShop-created .jpgs . That shouldn't take long, and shouldn't require any new skills --so it's a chance to consolidate your skills.