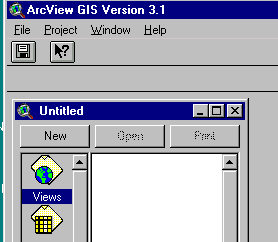
Click on New to open a View, and then on the + icon (just below Edit on the menubar) to Add a Theme.
Navigate to where the ArcView data are stored (e.g., d:\esri\aust
for Austrian data) and open the folder to see a list of .shp
files ("shape files"): 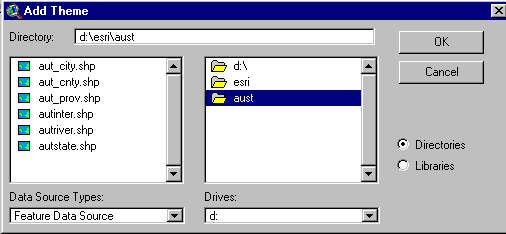
Shape files usually have
reasonably obvious names. Shift-click to select any combination and
they will appear on the left side of the View screen: 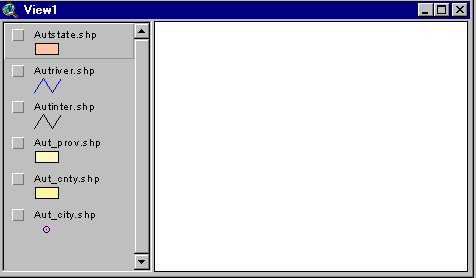
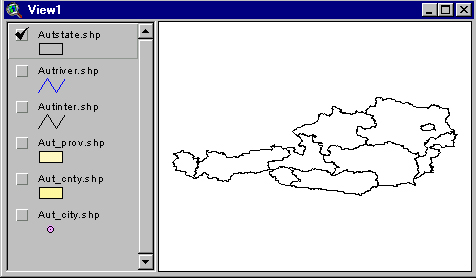
Now click in one of the checkboxes to display that shapefile (in this
case, I've clicked "Autstate.shp"):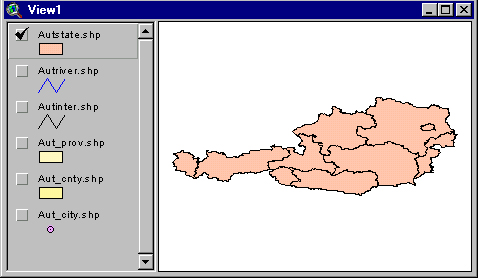
The resulting map of states in salmon doesn't please me. To change it to plain old black-and-white I double-click the salmon rectangle and the Legend Editor opens:Now I double-click the rectangle again, and once again see the Legend Editor, and choose "Graduated Color" from the Legend Type scrollbox: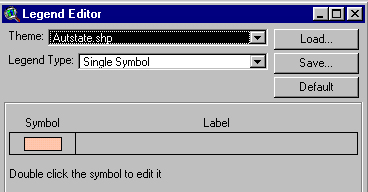
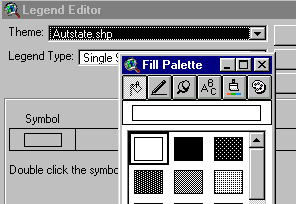
another double-click of the salmon rectangle permits me to edit the symbol --here I've chosen to outline the states, which I accomplish by clicking Apply:
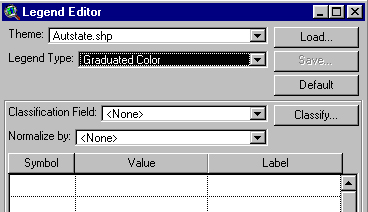
This allows me to explore the data available
for these Austrian states by looking in the Classification field:
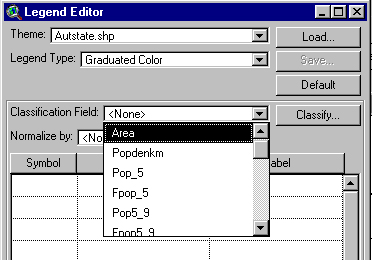
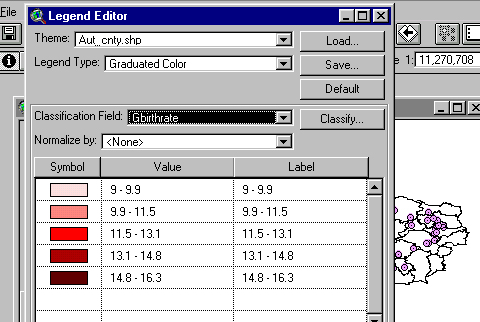
If I select one of the variables (say "Gbirthrate")
I'll see a distribution with (default) 5 levels 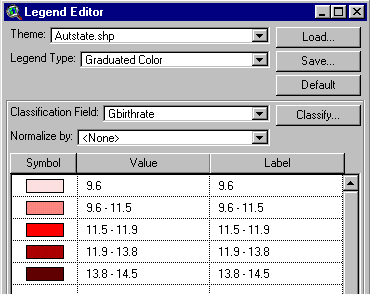
and
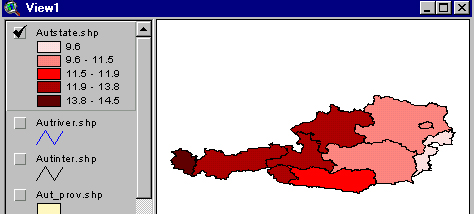
clicking Apply maps that distribution for the component states:
I could change the number of intervals or the display colors via the Legend Editor.
I could also examine the
data which lie behind the map by clicking on the Theme Table
icon (fifth from the left --or choose 'Theme' from the 'Table' entry
on the menubar): 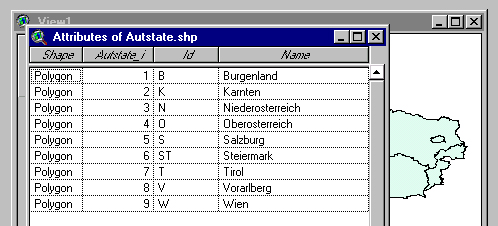
To see a different variable you might choose to uncheck Autstate.shp,
click Aut_cnty.shp, change the color of Aut_cnty.shp to simple outline, and
also click Aut_city.shp. Here's the result: 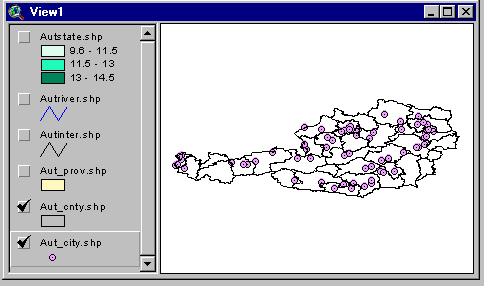
(note that
Aut_city.shp is selected --so double-clicking on it would produce the
Legend Editor for Aut_city.shp. No data are associated with the
cities, so at this point all we can see is their locations). The icon
in the second row at the far lest (i for information) allows you
to position crosshairs over an entity (like a city symbol) and click once
to see what data are available, in this case for the city of Zwettl
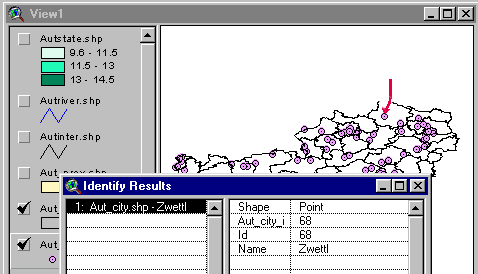 .
.
In the next example I've chosen Aut_cnty.shp and selected Gbirthrate:
and the resulting map looks like this: 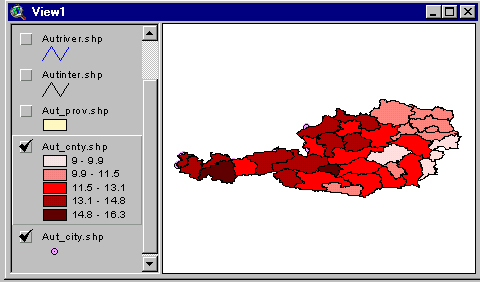
Note that the cities don't appear, though they are checked, but I can
bring them into view by click-dragging their Aut_city.shp box above
the Aut_cnty.shp box: 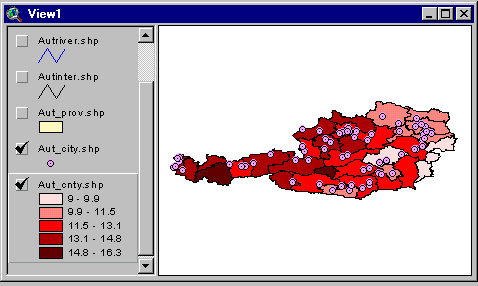
Another page covers adding variables to existing data, and there's another on adding point data. There's also one on dealing with ArcINFO .e00 files.