(The original text of the Washington Post article is available here. I was prompted to wonder which of its asseverations might be testable --or merely investigable-- using the 1990 census data, and the materials below were part of what I came up with in a couple of hours of playing around with the 1990 data in ArcView. As usual, more questions than answers...)
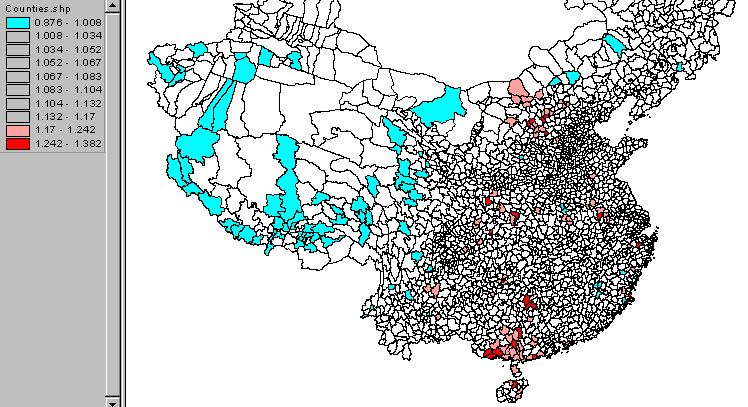
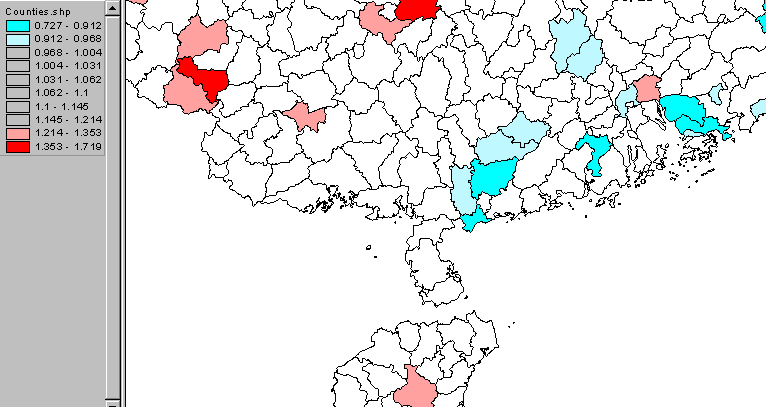
Here's a map of the extremes of sex ratio, for the 5-9 age cohort in 1990 (i.e., children born between 1980 --the beginning of the One Child policy-- and 1985), the Analytical Variable A10159:
Our question is: why these places and regions? The concentration of high-male in Guangdong and Guangxi screams for explanation, but where we'll FIND that explanation is an open question. And other questions come along in its wake, some answerable from the data we have: have these counties always had a preponderance of males?
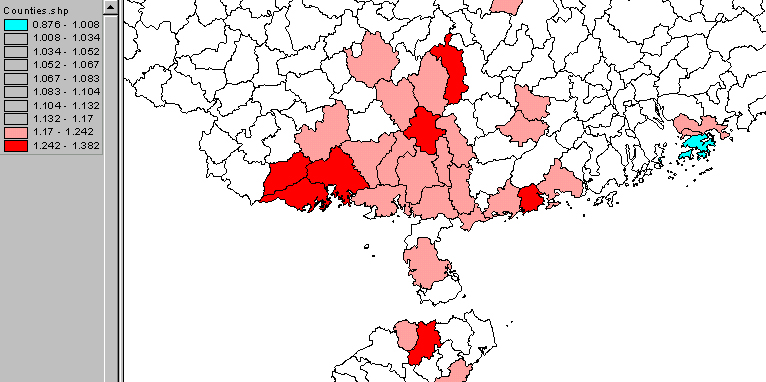
Here's a series of maps that lets the data tell the story --or ask more questions:
5-9 in 1990
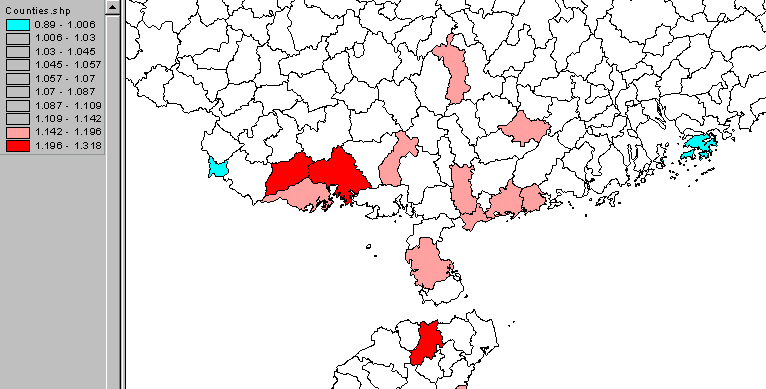
10-14 in 1990
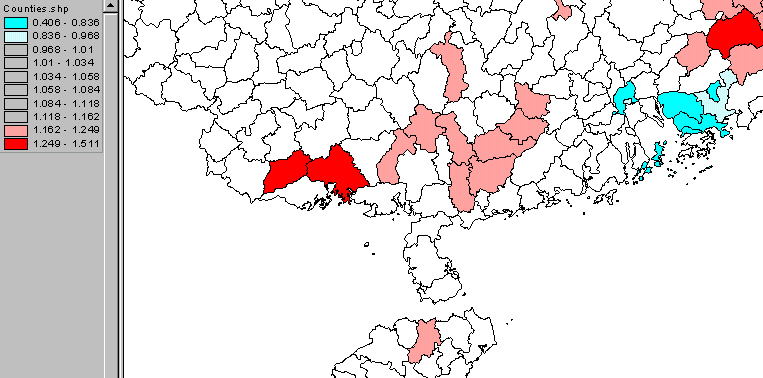
15-19 in 1990
20-24 in 1990
It's not too much of a surprise to find that sex ratio isn't quite so simple or so unitary. By the 15-19 cohort we begin to see the effects of differential migration, as more girls are drawn toward factory opportunities in the Special Economic Zones near Hong Kong; and in the 20-24 cohort, we may be seeing male emigration towards urban opportunities. And so on... clearly there's a lot going on, a lot to account for, but until I saw these maps I wasn't aware that I needed to ask about these phenomena in these Provinces that I'm looking into. Now I'm really curious about emigration...