This exercise should get you back into ArcView skills that may have faded in the last week, will also reimmerse you in empirical issues concerning your province, and should generate some questions for further research.I'd like you to make five maps of the distribution of economic activity within your province, using the following 1990 Census variables:
You'll start with your province's gwsxxx.shp file (so for HyeWon it's gwshunan.shp, for Monica it's gwssichuan.shp, etc.), set your working directory as before, make the maps, capture them with PrintScreen and convert to .jpgs with PhotoShop, and put them onto a Web page with appropriate labels. Then save the work as a Project (occupation.apr would be a good title) in your /anth/ folder. The instructions for PhotoShop are available for review at miley.wlu.edu/gis/easia/av28ix.html if you've forgotten the details.
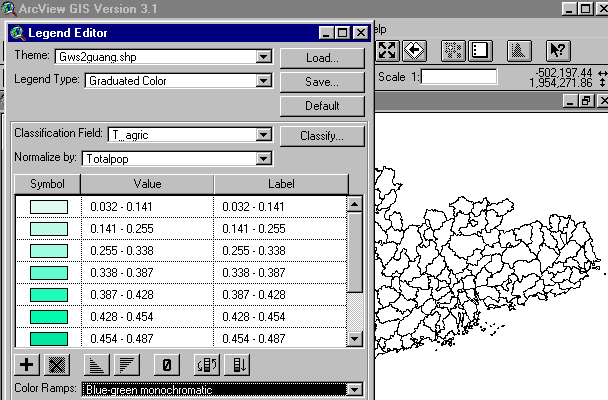
Here's how my map of Guangdong and Guangxi looks, starting with the Legend Editor screen. I've chosen to Classify... to 10 steps, but you can probably produce more elegant maps than these:
T_agric/Totalpop: Proportion of population in Agriculture: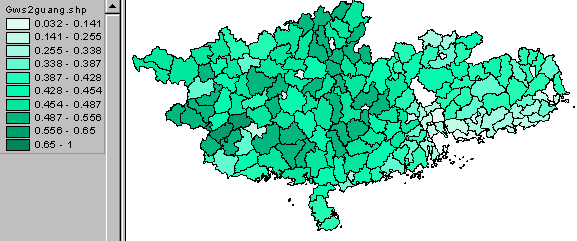
T_industry/Totalpop: Proportion of population in Industry: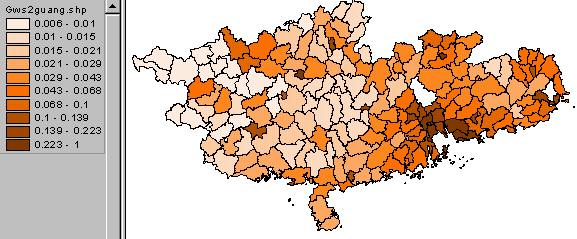
T_mining/Totalpop: Proportion of population in Mining: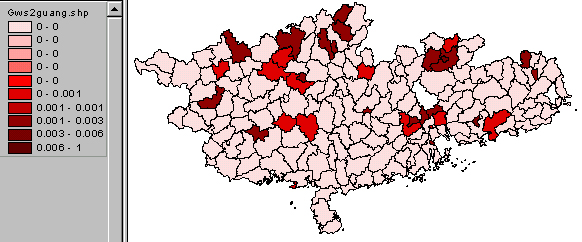
T_commerce/Totalpop: Proportion of population in Commerce: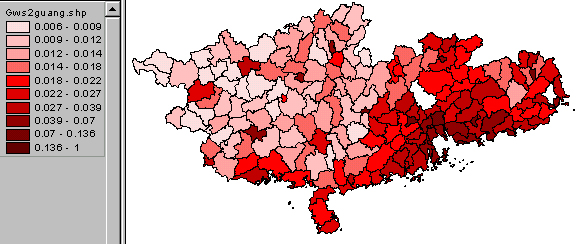
Total_immi/Totalpop: Immigrants as percent of Total Population: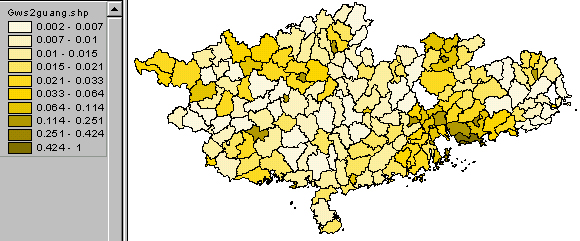
Once the six maps are made, use whatever resources you have for your province (like Web pages, the maps you made of the bright lights, any other data you already have on what's where and why) and write a brief explanation for each. Use ArcView's Identify tool ( ) to determine the names of census units [counties, cities, etc.] that seem particularly striking (lowest and/or highest values), and include those in your summary.
Here's a link to a brief thing I wrote about my maps of Guangdong/Guangxi. It isn't very well worked out --I haven't added in the names of counties I need to find out more about-- but some of the begged questions are articulated.