Using the Field Calculator to Explore Your Dataset

This exercise will take you into somewhat deeper waters in ArcView, involving editing the data behind .shp files to create new variables. The object is to explore the distribution of ethnicity in your province, in order to discover what you need to know more about. Some provinces are overwhelmingly Han, but most have significant minorities (and in some the Han are the minority).
Once again, careful attention to the details is essential...

  1. Start ArcView, opt for a New Project, and set your working directory to h:/public_html/anth/

  2. COPY THESE FILES TO YOUR h:/public_html/anth/:
    your province's set of FIVE ethxxx. files (so for KJ it will be ethjianxi.shp etc., and for Thaxton ethningxia.shp etc., etc.). Be SURE to copy the .dbf, .shp, .shx, .sbn and .sbx files

  3. Use the Add Theme button to (a) navigate to your h:/public_html/anth/ and (b) open the ethxxx.shp file

  4. Use the Open Theme Table button to display the Attributes of the .shp file. Here's what mine looks like:

  5. From the Table menu, choose 'Start Editing':

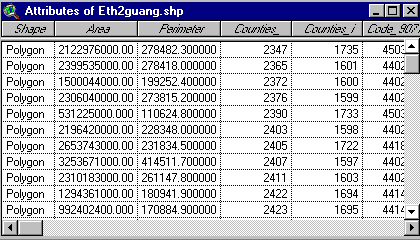
    (this makes it possible to ADD VARIABLES by manipulating columns)

    From the Edit menu, choose 'Add Field':

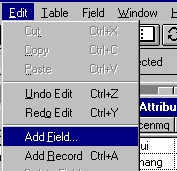
    A 'Field Definition' window will appear:

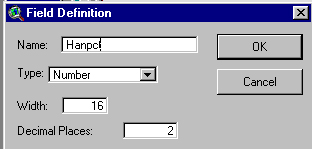
    in which you can NAME the new variable (I've called it "Hanpct" because I'm going to calculate the % of Han in each county) and specify the number of decimal places (I've chosen to change the default zero to 2. This will add the new column to the end of your Attribute table.

  6. Now from the Field menu, choose 'Calculate':

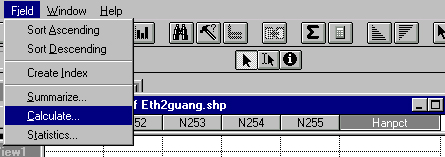
    This will bring up the Field Calculator:

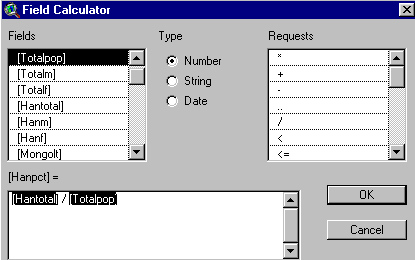
    As you see, I've entered in a formula by double-clicking [Hantotal], then the / for division, and then [Totalpop]. This completes the equation for Hanpct, and clicking OK runs the calculation and inserts the values into the new column.

  7. Now you want to sort the table on that column, to identify which counties have high percentages of Han and which low. If you click the 'Sort Descending' button (
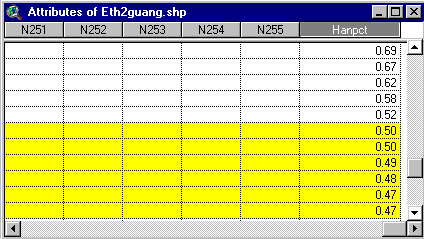
) you'll see the data displayed in highest-to-lowest order, and in lowest-to-highest if you click 'Sort Ascending'.

  8. Scroll through the table until you find a convenient breakpoint (in the example below I've chosen 50%). Hold down the SHIFT key and drag the cursor down to select the values below your breakpoint (i.e., in this case, counties with 50% or less Han in the population):

  9. Now go back to the View and note that ArcView has highlighted in yellow the counties you selected/highlighted:

  10. Capture this image with Print Screen and PhotoShop, and place it on a Web page, being SURE to include an explanatory label. Thus, I'd call mine "Counties with fewer than 50% Han population".

  11. Returning to the Attribute Table view, you can unselect those highlighted in yellow by way of the 'Select None' button ()

  12. Now open the Legend Editor, choose 'Graduated color', and go to the end of the list of variables and choose 'Hanpct':

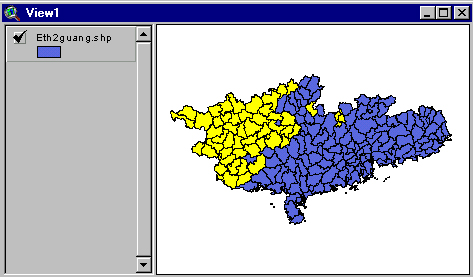
    and make a pretty map. Capture it, and label it accordingly. This one would be "Percent Han population in Guangdong and Guangxi":

  13. Identify minzu (ethnicities) which are especially numerous by exploring the Attribute Table, using the 'Sort' buttons to order various columns, and adding new columns to calculate the percentages of the most significant groups. Make elegant distribution maps and save them to Web page(s) with appropriate labels. The result will be a mini-atlas of minzu distribution for your province.

  14. Finally, when you've done all you can/wish to do, choose 'Stop Editing' from the Table menu:
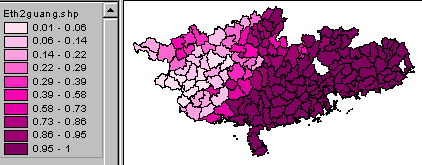
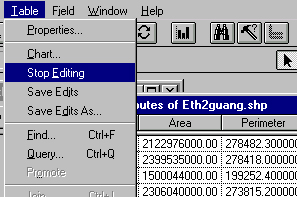
    , and say YES to "Save Edits?". The new values will be saved to the h:/public_html/anth/ethxxx.dbf file you specified (by setting your Working Directory). Choose Save Project As..., navigate to your h:/public_html/anth/, and name the project minzu.apr