From the Start menu, RIGHT-CLICK My Computer, choose Map Network Drive..., set Drive ro R:, in Folder: type \\acadproj\vol8 and make sure that Reconnect at Login is checked, click Finish.If the R: is X'd out when you login later, RIGHT-CLICK on My Computer, choose Disconnect Network Drive, remove R:, and then repeat the connection process above.
Start ==> All Programs ==> Research Tools ==> ArcGIS ==> ArcMap
you'll see 4 Layers (fujiancities, gwsfujian, provinces, counties) and a map of Fujian.
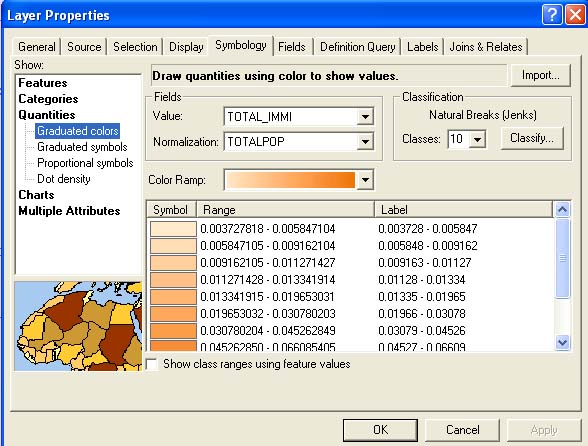
In its default form, as you opened this project, the map shows Immigrants as a % of total population in Fujian counties (Total_Immi 'normalized' by Totalpop), with the values spread over 10 classes and represented by an orange-brown Color Ramp. You can change Fields, change the number of Classes, and change the Color Ramp. Changing Fields allows you to map different variables.
Use ArcGIS to open your saved gwsfujian.mxd project (in YOUR /anth230/ folder, not from the R: drive). Use the 1990 Census Variables and choose something that interests you. Make a couple of maps from the data and Export them as jpgs to your /anth230/ folder. Make links to those jpgs in your log file, and explain briefly what the maps are showing (what variable[s] you chose for each). Nothing very analytical here --it's just to give you a bit of practise with ArcMap (701 [Han Chinese total] normalized by 102 [Total Population] would be an obvious beginning).