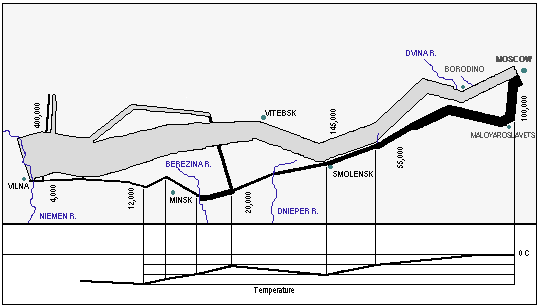
Nearly every escape from flatland demands extensive compromise, trading off one virtue against another; the literature consists of partial, arbitrary, and particularistic solutions; and neither clever idiosyncratic nor conventionally adopted designs solve the inherent general difficulties of dimensional compression...(Tufte 1990:15)

Mathematics and Imaging (Swarthmore Math Awareness Week, 26 April - 2 May)
Whence cometh coordinate systems? We take 'em for granted, but they really made possible an intersection of algebra and geometry once they were introduced.
Coordinates, which were first used by Apollonius of Perga (fl. c.225 BC) to identify points on a conic and developed further by Oresme (fl. c.1360), Rene Descartes (1596-1650), and Pierre de Fermat (1601-65), are used extensively today in the study of geometries. They are usually called Cartesian coordinates, in recognition of Descartes' work on coordinate systems.(http://acnet.pratt.edu/~arch543p/help/geometry.html)
The scatter plot may well be the single most powerful statistical tool for analyzing the relationship between two variables x and y. (Chambers et al. 1983:75)...often very useful when one or both variables are derived variables, that is, variables resulting from computations on the original observed data... (80)
We gain further insight into what makes good plots by thinking about the process of visual perception. The eye can assimilate large amounts of visual information, perceive unanticipated structure, and recognize complex patterns; however, certain kinds of patterns are more readily perceived than others... we conjecture that the eye is able to perceive
To this list we add two more points that have more to do with the associated mental processes:
- location along an axis more easily than other graphical aspects, such as size
- straight lines more clearly than curves
- simple patterns more quickly than complex ones
- large or dark objects, or clusters of objects, with greater impact than small, light, or isolated ones
- symmetry, especially bilateral and circular symmetry
- we can sometimes perceive several different aspects in one plot, simply by switching attention from one aspect to another
- accumulated visual evidence is roughly additive (320-321)
Zipf's Laws in the Voynich Manuscript (G. Landini)
summary and bibliography from Rockefeller University
and Zipf exposed by mathematicians (n.b. Mandelbrot!)
Top hundred words in English