The steps I went through:
I copied the source code of the Web pageIn this case it might have been faster to simply transcribe the data from the Web page, editing an ArcMap attribute table by adding the values manually...
used WordPad to strip out all but the Table, and to replace the < and > of the HTML tags with \\ and // characters
used Word to replace \\ and // with ^t (the character for TAB)
saved as a .txt file
imported to Excel as a tab-delimited file
cleaned up the various columns to produce a file to save in .dbf format (with significant digits specified)
imported the Excel .dbf into Access
exported from Access as a .dbf file (not the same as an Excel .dbf)
opened a map of countries in ArcMap, and added the Access .dbf to the project
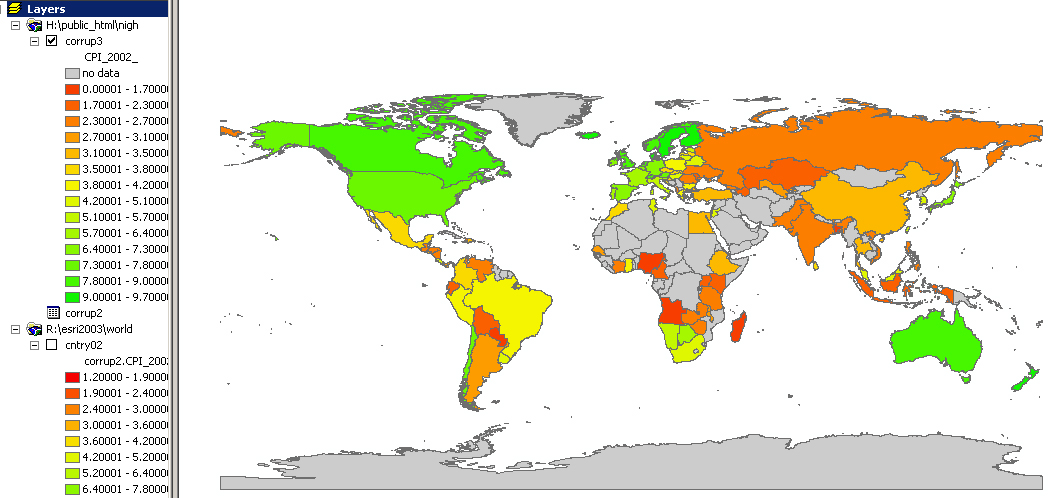
JOINed the countries map and the Access .dbf on the appropriate columns and mapped the result
exported the Joined dataset as a .shp file
edited the .dbf file of the new .shp to fix a few name mismatches (USA for United States, etc.)
saved the project in R:/global