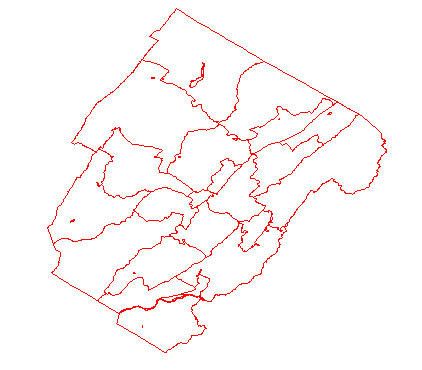
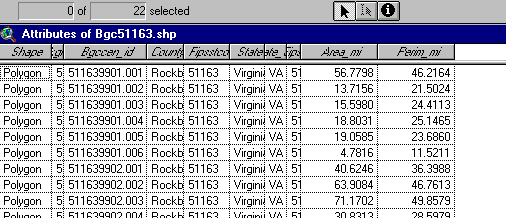
I knew that we had TIGER coverage for Virginia, tucked away in a folder on Miley (Va_tiger), and it turns out that one of the layers is outlines of the census blocks(22 for the County, plus Lexington City and Buena Vista City):
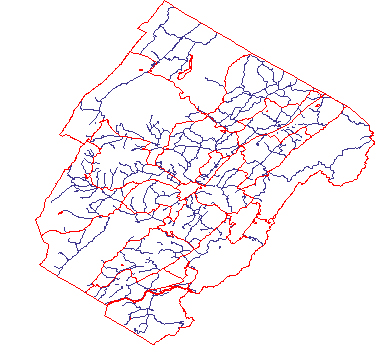
TIGER doesn't provide any direct information on population distribution, though I flirted with using the pattern of roads as a proxy for population distribution --obviously, where no roads, not many people, but that's not very useful:
I reasoned that we could probably get the numbers of households (or children under 15, or mobile homes, or whatever) for those census blocks, and those data would provide the basis for constructing maps that would give a coarse idea of distribution of population within the county.
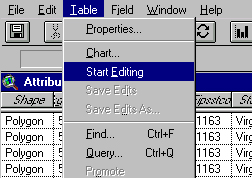
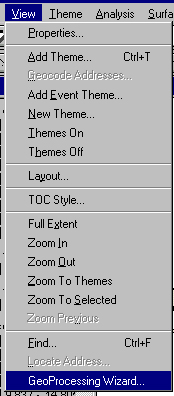
How to find the requisite census data? We probably have the little numbers in the 1990 Census reports, but copying them out seemed too arduous if they could be found online. I tried www.census.gov and (after a bit of exploring) found venus.census.gov/cdrom/lookup and eventually to venus.census.gov/cdrom/lookup/949077899 which allowed me to choose a specific block group within Rockbridge County, and then specify tables to retrieve (total population, households, etc.). I could see the results as a web page, or opt to retrieve the data in tab-delimited form for import into a spreadsheet. So the data acquisition problem was solved fairly easily. Now how to make the maps, associating the various data with the correct polygons on the TIGER map in ArcView?
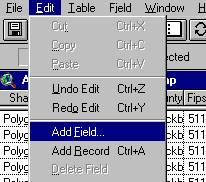
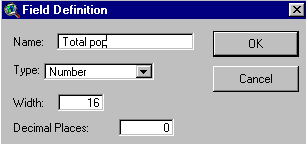
 ) and then clicking in the cell you wish to add a value to.
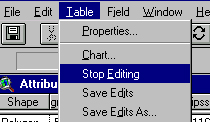
and save the result with the same name as the TIGER layer and in the same folder (there must be a way around this, but at the moment I don't know what it is). You'll be in effect replacing the .dbf file of that layer with another .dbf, augmented with your added data.
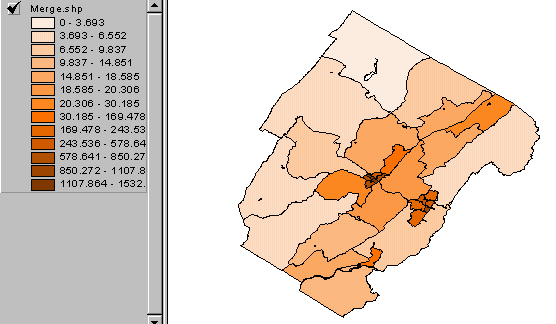
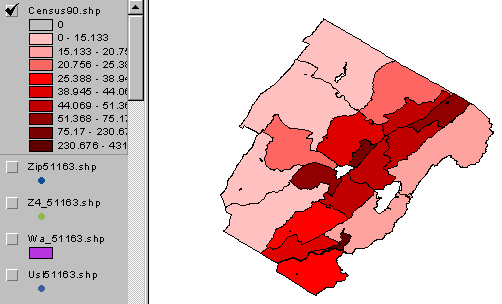
The procedure above led me to these maps of Rockbridge County:
Population density per square mile for the county census blocks from the 1990 Census:
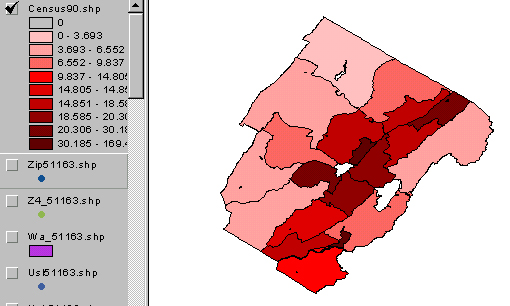
And another showing households per square mile for the same census blocks:
I then addded data for Lexington and Buena Vista (the white spaces in the maps above) by
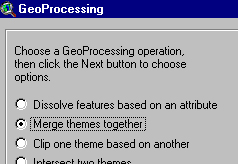
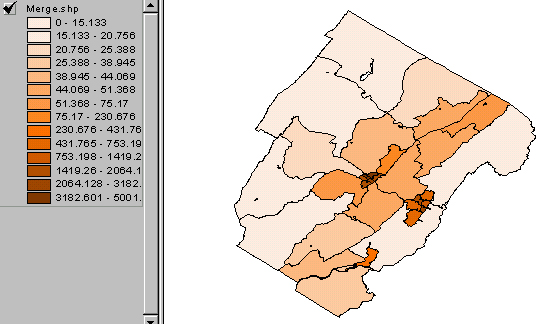
as a new theme ('merge.shp'), the attribute table of which I edited to add the data for the two cities (and stopped editing, saved, exited, reentered...)
Here are the two resulting maps:
Persons per square mile:
And Households per square mile: