Working with .shp files: maps of ethnic identity
The first thing you'll do is make a map of % Han in your province(s). For that you'll need to find the requisite variables (Han population and Total population), which turn out to be 701 and 102 (see 1990 Census Variables)
Make your provinces layer active by clicking anywhere in the rectangle.
- Double-click anywhere in the raised grey rectangle of the View1 window to open the Legend Editor window:
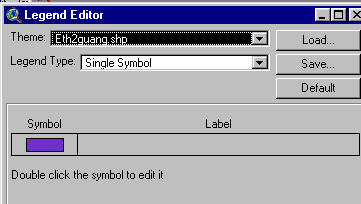
- Double-click the colored rectangle to open the Fill Palette window:
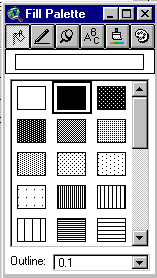
Double-click the 'empty' shape to the left of the black shape, and then click the Apply button at the bottom of the Legend Editor window. Close the Fill Palette.
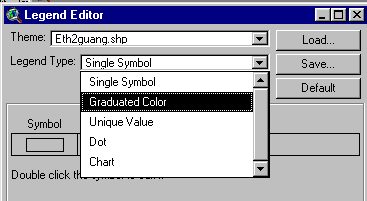
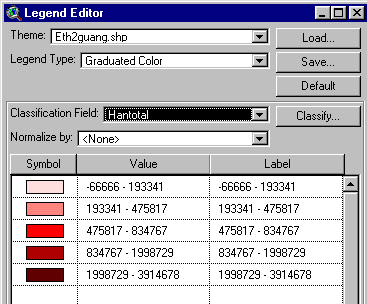
- Now pull down the Legend Type: selector in the Legend Editor window, and choose 'Graduated Color':
- Pull down the Classification Field: selector and find 701 (total Han)
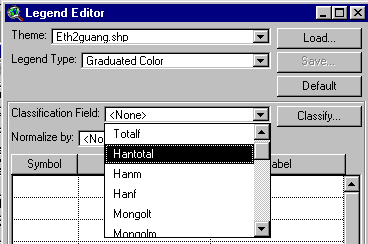
You'll see a range of numbers appear:
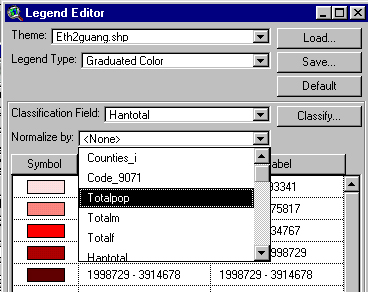
- Pull down the Normalize By: selector and locate 102 (total population)> ArcView does the calculation 701/102= and returns %.
- Click the Classify... button, change the number of classes to 10, click OK (ArcView recalculates with 10 intervals),
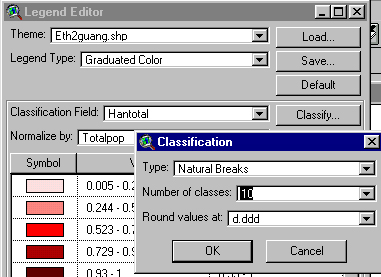
and hit the Apply button to see the results (close the Legend Editor window):
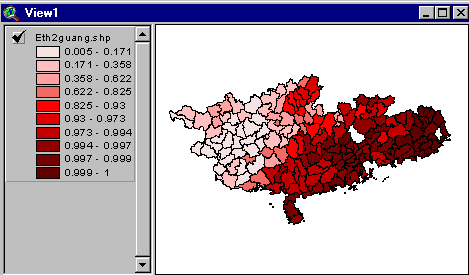
What you see is a map of % Han in total population, by county. I could map the % of other ethnic groups by choosing others in the Classification Field. Note that I have a couple of anomalies --two counties that seem to be missing data. For the moment they are a puzzle.
You can use the Identify cursor (click the  button, then click on a county to see the data associated with it) to explore the data county by county. Look at some of the LOW values for Han and ascertain which ethnic groups are predominant in those areas by looking at the Attribute Table in the 700s (see 1990 Census Variables and look for ETHNICITY). Eventually you'll want to explain why for your Province(s), and you'll be able to return to this Project file to do further explorations. You'll also be making maps of other variables.
Now grab this image just as you did in the earlier exercise:
- Hit the Print Screen button on your keyboard (this copies the screen's contents to the Clipboard)
- Now open PhotoShop and proceed as before, finally flattening the image and saving it as .jpg.
- Insert the image in a new page, using FrontPage, LABEL your map (e.g., "Percentage Han in the counties of xxx and yyy provinces"), and then save that page as 'ethnicpct.html' in your /anth/ folder.
- Go back to ArcView, choose Save Project As... from the FILE menu, navigate to your /public_html/anth/ folder, and enter the filename as map2.apr so that you can open it again.
- Close ArcView
It's important to practise these steps, to develop your sense for how ArcView works. Your assignment for Tuesday 23 Oct is to make a few more ethnicity maps, showing the distribution of other ethnicities within your province(s) (choose those that have substantial numbers), and add them to that same ethnicpct.html page. Be sure to LABEL any you add, so you can figure them out later and so that I'll comprehend what you've done.
You may wish to explore for further details on minzu (ethnicities/nationalities) which turn up frequently in your province(s). One source you should know about is the Encyclopedia of World Cultures in the Leyburn REFERENCE area: REF GN550 .E53 1991. Also try Ethnic Minorities in China, worth a look for an overview of numbers and distribution of the recognized minzu.