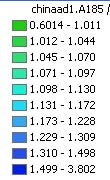
Consider these examples from the gwsfujian.mxd dataset (1990 Census):
TOTALMALE normalized by TOTALFEMAL (with color changed) looks like this:
and here are 0-4, 5-9, and 10-14 M/F:
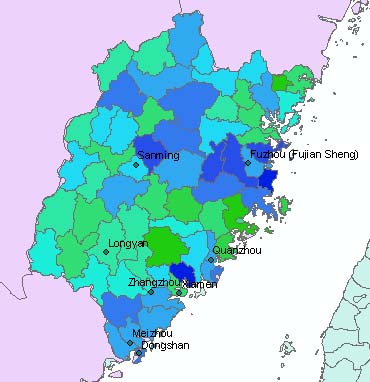


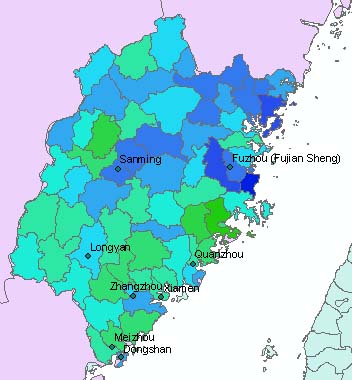
Let's put into words what these 4 maps show:
- those in the 0-4 cohort were born between 1986-1990, those in 5-9 between 1981 and 1985, and those in 10-14 between 1976 and 1980.
- some counties are consistently HIGH and others consistently LOW in the M/F ratio
- as a generalization, HIGHer M/F seem to be in the more northerly counties of the province
WHY? What is this showing us?
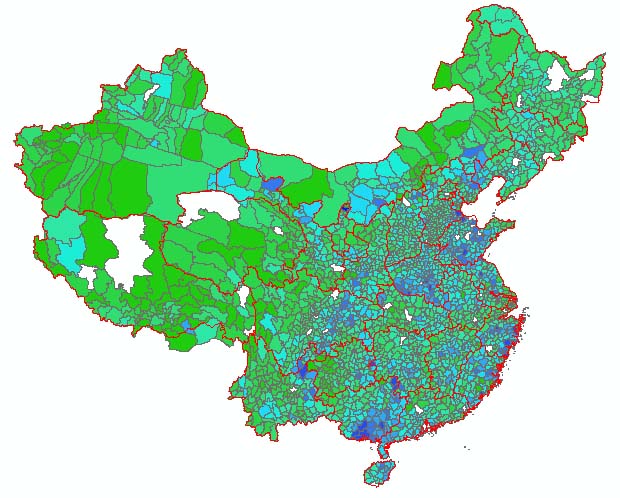
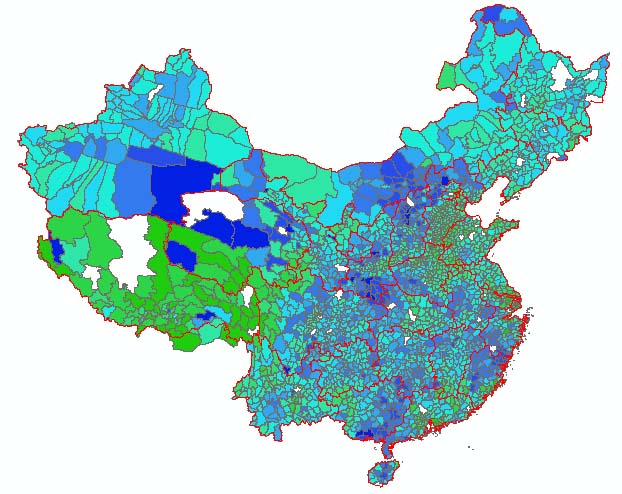
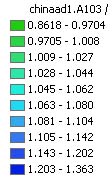
Consider the patterns for ALL counties of China:
...and the 0-4 cohort: